Every single time I want to consider myself done with the PSRayTracing project, I find myself running back to it for something. Recently I’d like to start contributing to another ray tracer that was also based on the same books, so I asked the main developer if he had any testing infrastructure up. Other than some sample files, He really didn't.
So as to set a good example, adding some automated tests to PSRayTracing would be best! Before we begin, I want to note that testing software is a very broad topic, with all sorts of opinions flying around: test driven development, "Write tests, not to many. Mostly integration", behavior driven testing, achieve 117.3% coverage via unit tests only, etc. In this blog post, I want to show you how I did it for mine. The testing code is approximately 300 lines long. I try to break down each important part into bite size chunks, though things will be omitted for the sake of brevity. If you want to go and see the whole script, it’s available here.
I want to also note that the testing principles and techniques outlined here aren’t only for ray tracers. They can apply to more real time systems and just about anything under the sun of graphics programming. Please read this as a general guide on the topic, but not the end-all-be-all for the subject.
Methods of Testing
As mentioned before, testing can be a very hot topic.
Unit Testing vs. Integration Testing (for a Ray Tracer)
Two of the major camps in automated software testing are Unit Tests and Integration Tests. In a nutshell, unit tests are meant to be tests for small portions of code (e.g. a single math function) that can be run quickly (e.g 1 millisecond), and there should be a lot of them. Integration Tests on the other hand are meant to test a much larger chunk of code, and that all the smaller bits when added up together work as intended (e.g. a system that scans a directory for images and generates smaller proxy files). These tend to run much longer, definitely in the realms of seconds and quite possibly minutes.
Integration tests are my personally preferred method since it lets you look at the sum of the parts, getting a much bigger picture. It is also better for any larger existing projects that you might have inherited. You might not know how a small portion of the codebase is supposed to work, but you know what the expected output is supposed to be. Integration testing shines for that. Unit testing still has its place, as they can help pinpoint better where a regression happens. So for PSRayTracing, I'd think it would be best to go with integration testing as the primary method.
You could also set up a project where integration tests are your main source of testing, but as you add new functions, you add tiny unit tests for those. Whenever a bug might be found and fixed for existing code, you then add up a unit test for that case as well. That way you can have the best of both worlds. There are many times at jobs where I thought writing integration tests would be more robust, but other times I kept on running back to the same function to fix some minute detail.
What Exactly Can We Test?
This should be obvious; the generated renders from PSRayTracing. This is simple enough as looking at some inputs (on the command line) and marking sure we have the same output. Another topic to look at is performance testing too. While functionality/reproducibility comes first, performance is another very important aspect. Back in 2013, some of the scenes in Disney's Frozen took upwards of 30 hours to render a single frame! If you're making any change, it's very worthwhile to see the impact of that change on the render time. Good performance is a feature you don't want to break.
idiff (à la OpenImageIO)
The main workhorse of the testing program is going to be idiff. Given two images, it can tell us if they differ and by how much. PSRayTracing is supposed to be 100% fully deterministic, meaning that given a specific set of inputs, we should always have the same output no matter how many times the application is run. Down to the noise artifacts generated it should render the same! idiff's pixel perfect requirements help with this. While we could always write our own code that checks two images, it's much better (and easier) to use the work someone else has done for us. If your OS is anything from the Debian/Ubuntu family, you can easily get this utility from APT via the openimageio-tools package.
Take for example these two renders of the earth. The first one uses actual trig functions to paste the texture on the sphere, whereas the second uses faster trig. approximations.


If you're having some trouble trying to find the differences, look around the UK. The latitude line is slightly shifted. If you load up the images in two separate tabs and then quickly swap between them, you might be able to spot the difference more easily.
With idiff, here is how you check for equality:
$ # An example of a passing case:
$ idiff asin_ground_truth.png asin_ground_truth_copy.png
Comparing "asin_ground_truth.png" and "asin_ground_truth_copy.png"
PASS
$ echo $?
0

$ # An example of failure:
$ idiff asin_ground_truth.png asin_approx_with_ec.png
Comparing "asin_ground_truth.png" and "asin_approx_with_ec.png"
  Mean error = 0.000346436
  RMS error = 0.00412951
  Peak SNR = 47.682
  Max error  = 0.552941 @ (548, 408, B)  values are 0.403922, 0.521569, 0.145098, 1 vs 0.192157, 0.52549, 0.698039, 1
  46169 pixels (4.4%) over 1e-06
  46169 pixels (4.4%) over 1e-06
FAILURE
$ echo $?
2
It gives us a nice standard return code of 0 for pass and a non-zero for failure, and even goes into some detail. It can even produce show you were your images were different, if you pass in -abs -o <filename>.jpg into the command. (Note: I recommend creating a JPEG image, it's really hard to see on a PNG)
idiff -abs -o diff.jpg asin_ground_truth.png asin_approx_with_ec.png

As stated before idiff checks that images are pixel perfect. You might argue that the above two globe renders are the same image, or are practically the same. That's because they are very "perceptually similar". There's another tool available called Perceptual Image Diff which acts a lot like idiff, but also factors in parts of the human visual system to test how perceptually similar two images are. There's a lot of science in regards to human visual system and psychology that plays into this. If you're interested in this, read up on Color Science and related topics. It's a truly fascinating subject, but this is all beyond the scope of this document. If you're really interested in computer graphics, it's very worth looking into this subject as well since it's very beneficial for the field of computer graphics (e.g.it's how JEPG works).
Testing PSRayTracing
While it's going to be idiff doing all of the heavy lifting, a small vanilla Python script (approx ~300 lines) that will be running the show. Before we write that, we need to do a little infrastructure work. One important note is that project uses CMake for the build, and it assumes you've named the main build folder as build, and it's in the root of the repo; a fairly standard practice. How to do this is outlined in the repo's README right here.
Adding a "Testing Mode" to PSRayTracing
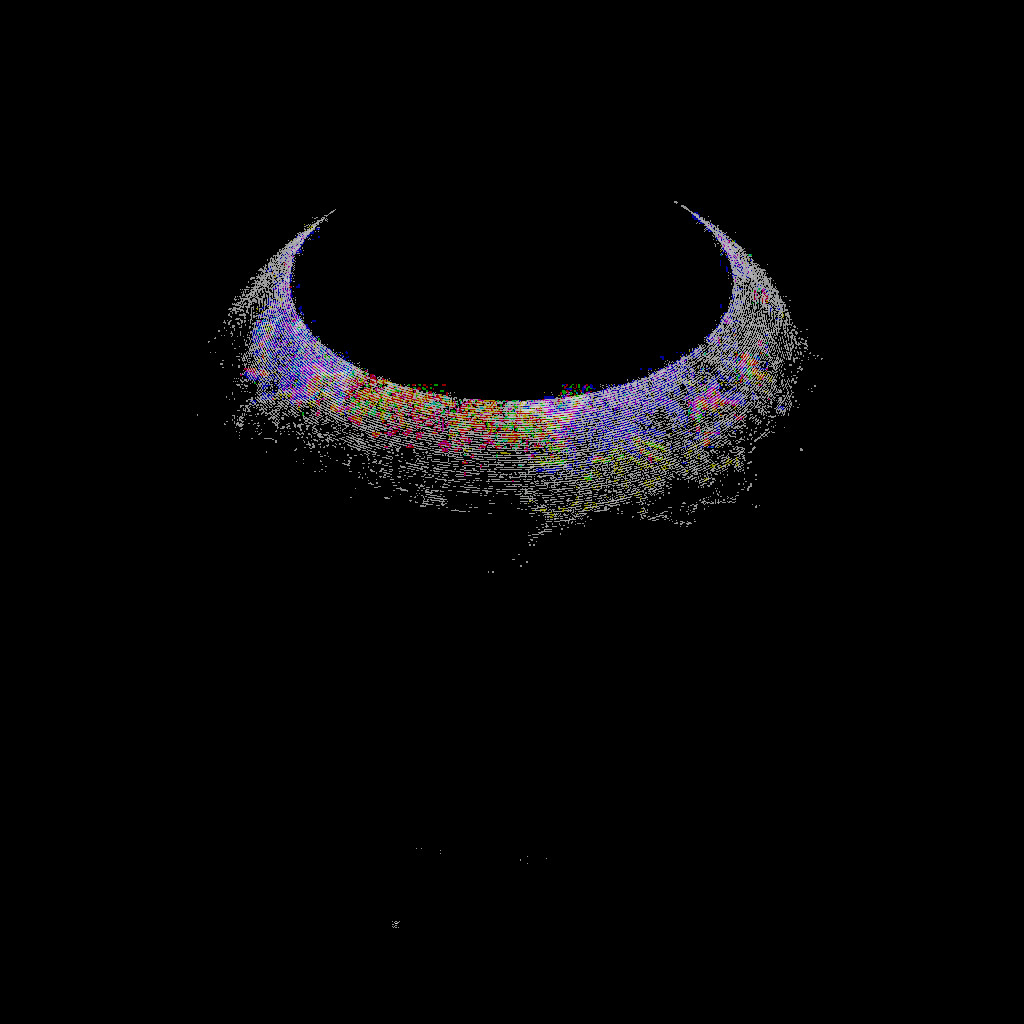
We're going to be relying on the command line output from PSRayTracing for our testing script. If you were to simply run the program and watch the console, something like this should appear on screen:
Scene: book2::final_scene
Render size: 960x540
Samples per pixel: 10
Max number of ray bounces: 50
Number of render threads: 1
  Copy per thread: on
Saving to: render.png
Seed: `ASDF`
Rendering: [=============>                                    ]  27% 5s
While this is very handy for someone waiting for a render (e.g. they see info and are given an updating progress bar), for testing this is a lot more noise than we need. A "testing mode" needs to be added in. The only things we care about during testing are:
- The render was completed without any program failures
- How long the render took
The code changes required are very simple:
- Add in a command line flag
--testing-mode - Suppress any normal text output if this flag is set to
true - Upon render completion, print out the total time, as nanoseconds
If you want to see the changes, you can read the commit diff right here. It's only about 20 lines in the main() function with some if checks. This being one of the more important parts:
This simple change now lets us do performance metering!
Generating Test Data and Test Cases
Aside from performance, figuring out what we can test for correctness is the next on the agenda. As stated before, Python will be used for the testing script. Writing automation code in needed and Python really stands out in this respect; it's our knight in shining amour.
Looking at the Parameters of PSRayTracing
Supplying --help to the program gives us a list of all the things that can be configured, most of them being options that effect the render. They can be further divided into two categories: those that can change the output, and those that shouldn't but can alter performance.
$ ./PSRayTracing --help
Options:
  -h [ --help ]                         Help screen (this message)
  --list-scenes                         List all of the available scenes to
                                        render
  --scene arg (=book2::final_scene)     Scene to render
  -s [ --size ] arg (=960x540)          Render size
  -n [ --num-samples ] arg (=10)        Samples per pixel
  -j [ --num-threads ] arg (=1)         How many threads to render with
  -d [ --depth ] arg (=50)              Maximum ray bounce depth
  -r [ --random-seed ] arg (=ASDF)      Seed string for the RNG
  -o [ --output-filename ] arg (=render.png)
                                        Filename to save render to (PNG only)
  --no-progress-bar                     Don't show the progress bar when
                                        rendering
  --no-copy-per-thread                  Don't make a copy of scene per thread
  --testing-mode                        Run in testing mode; only outputs how
                                        long render time took
What changes the output:
--scene, This is simply what picture will be rendered.- I want to note that normally a ray tracer would allow you to specify a scene as a file that can be loaded at runtime. But that wasn't in the original book code. This feature would take a while to implement. So instead I opted to keep the hard-coded scenes.
--size, The dimensions of the picture.--num-samples, How many samples to take per pixel. The larger the higher the quality (but also the longer the render time).--depth, How many times should a light Ray bounce. Bounce too much and renders can take forever. Bounce too little and colours may not look correct.--random-seed, A string which seeds the random number generator. This effects the noise of the image.
What doesn't change output:
--num-threads, Regardless if we render with one thread or eight, the resulting image should still be the same, even down to the grain of the noise. Changing this value should only effect render performance.--no-copy-per-thread, I noticed if each thread had its own copy of the scene graph, rendering would be much faster. If you want to read more about this, check out the section in the project's README.
Making Combinations of Arguments
Looking as the possible arguments, the range of possible inputs is infinite. For simplicity sake, let's pick some. This is left at the top of the file for ease of adding new options later on, or tweaking them.
You might notice that I haven't specified any scenes, but if you remember PSRayTracing has a another flag --list-scenes. This well, lists all of the possible scenes. We can use Python's check_output() to run in this mode and grab the list.
$ ./PSRayTracing --list-scenes
Available Scenes:
  book1::surface_normal_sphere
  book1::grey_sphere
  book1::shiny_metal_sphere
  book1::fuzzy_metal_sphere
  book1::two_glass_one_metal_spheres
  ...
In total, there's 35 of them.
The other benefit of this too is since is scans our application for scenes, if we add any new ones, we don't need to update the testing script per se. The master branch of this project contains scenes from books 1 & 2. Where as a separate branch book3 exists for that respective book's scenes (since then rendering logic is radically different in the final book). Now that we've collected a series of inputs for all of the rendering arguments, we can leverage the itertools.product() function. Given a list of lists/tuples (of varying size), it will then produce each possible combination.
Really astute readers might notice that we've gone and generated 35 x 3 x 2 x 3 x 3 x 3 x 3 possible combinations of arguments. My calculator says that computes to 17010 options. Now, if all of our these possibilities were to render in about 1 second it would take around 5 hours for that. But in reality, each render is anywhere between 1 to 120 seconds long on my computer. To run a full suite, we'd be here for days; if not weeks. So here it would actually be best to take a sub-sample of those possible options and then use those. generate_test_cases() has a parameter tests_per_scene (default being 10). It's simply an integer where we can specify how many different tests we want to run per scene.
Lastly to finish up, give each test case its own unique number and then save each one as an entry in a CSV file; which will be read back in during actual testing.
Now with this, we have a set of test cases that we can run, all with different options to feed to the program. We can refer to this as our "reference testing list". Later on, we'll do a "reference run", which will well, serve as our reference to test against when code changes are made. This generated CSV file is something we'll actually want to commit to our code base, as the common set of tests to use. I wouldn't recommend committing the renders themselves since it could make the repo a bit more hefty than it needs to be. It's much easier to pass around a single CSV file that's only 50 KB, versus hundreds of renders that can total 100 MB (or more).
Running the Test Cases
Before we get into the meat of the code that will run the test cases we'll need to construct three helper functions first. To start off, we need to write the function that will actually run idiff against two images. Leveraging check_output() again, it's quite simple:
If you remember from far above, I did mention that there are program options that shouldn't change the output. This is yet another thing that we should test: "different cases that should produce the same render". The final two functions will tell us if some test cases should produce the same pixel-for-pixel picture.
With that out of the way, let's start on run_test_cases(), that aforementioned "meat". It's a tad bit big, so I'm going to break it down a little into multiple sections. This function will take in the CSV file we made earlier, and then as the name implies, run the cases. Since we also need to first generate a "reference run" (for later code changes to be tested against), this function will also need to take in another parameter to know if we're rendering the references, or actually testing against them.
At the bottom of the snippet you'll notice that we also make a second CSV file. While we will print out the results of each case to the terminal, we also should save them to another other place where they can be retrieved later. It mostly follows the same format as CSV we read in, except that we add on two extra fields. "How long the render took" and "did it match the reference?"
CMakeCache.txt file from the build/ folder. If you're wondering why this might be helpful, it's possible that how the software was built can impact performance. E.g. if the reference test was built against GCC, but when doing later development you use Clang, you're going to see some differences in performance. One could simply run diff on the two CMakeCache.txt files and see what was different in the builds.With the test cases read in, we can actually now run them through the executable. Once again check_output() is being used, but this time, with also passing in the --testing-mode flag to the ray tracer.
When we're doing a real test run, we'll also need to check if the produced render matches the reference. For that, we'll use the test_images_match() function we built above:
And at the end of that, we'll just want to print out (and save) some of the metrics from the case:
That should be the end of our main loop where we run all of the test cases; it will take a while.
Right after it, we need to verify those test cases with different arguments but the same output. We've already figured out which cases are supposed to have matching renders. We'll use that data and verify the results:
And finally, one more metrics info block. But this time it's a summary of all of the tests:
One of the more important metrics here for the user is the total time it took to complete all of the renders. It runs off of a simple accumulator (measure all of the nano seconds it took). Sometimes we can have code changes (e.g. micro optimizations) that are so small to see individually, and we'll need to verify inductively by rendering a lot of tests over a very long time.
This completes the run_test_cases() function. The last thing that needs to be done is adding in a main() function.
Finishing Up the Testing Script
There are three different ways that this script can be used:
- Generate test cases
- Do a "reference test" run
- Do an actual test run
Generating the test cases will be something that will happen very rarely along with doing "reference test" runs. For those, we'll hide them behind some flags. -g for generating test cases. And -r for doing the reference run; we'll also have -r generate test cases if there is no CSV file found.
You'll also notice that there is a -n argument too This is so we can specify how make test cases to generate per scene. When I did my first reference run, it took about 50 minutes to render every test case! I thought that was WAY too much. After, I entered in a lower value for -n to find a sweet spot where I got enough tests, but also doesn't take too long.
Doing a Reference Run
The script is now complete. It's time now to do a reference run. With the script saved to the root of the repo, simply do: python run_verification_tests.py -r in a terminal. If everything was run, you should see something like this:
Wrote 350 test cases to `test_cases.csv`
Running 350 test cases:
  Test 001/350: [0.204 s]
  Test 002/350: [0.206 s]
  Test 003/350: [0.305 s]
...
  Test 349/350: [0.910 s]
  Test 350/350: [2.110 s]

Verifying cases where renders should be the same:
  test_cases.csv_refernence_renders/059.png -- test_cases.csv_refernence_renders/079.png : PASS
  test_cases.csv_refernence_renders/065.png -- test_cases.csv_refernence_renders/068.png : PASS
...
  test_cases.csv_refernence_renders/288.png -- test_cases.csv_refernence_renders/290.png : PASS
  test_cases.csv_refernence_renders/311.png -- test_cases.csv_refernence_renders/319.png : PASS

Total render time was 730.408 s
On my beefier machine this took about 12 minutes to complete, which I think is fairly acceptable. With 350 cases to test for correctness (including render time) and some cases with matching output to verify, I think this is good To prove that this testing works, let's intentionally break the ray tracer!
Doing a Real Test
Step 1: Mess with the RNG. Edit the main.cpp, where seed_str is set. Put this extra fun bonus in there:
Step 2: Re-build the ray tracer. Step 3: Run the testing script without any flags: python run_verification_tests.py
Running 350 test cases:
  Test 001/350: FAIL [0.204 s]
  Test 002/350: FAIL [0.201 s]
  Test 003/350: FAIL [0.307 s]
...
  Test 349/350: PASS [0.907 s]
  Test 350/350: PASS [2.108 s]

Verifying cases where renders should be the same:
  test_cases.csv_renders/059.png -- test_cases.csv_renders/079.png : PASS
  test_cases.csv_renders/065.png -- test_cases.csv_renders/068.png : FAIL
...
  test_cases.csv_renders/288.png -- test_cases.csv_renders/290.png : FAIL
  test_cases.csv_renders/311.png -- test_cases.csv_renders/319.png : PASS

Total render time was 720.795 s
If everything was "successful" (sort to speak), the tests should fail about half the time. You can also check the results.txt file that's saved in the test_cases.csv_renders/ folder for another summary:
169/350 tests passed
Total render time was 720.795 s (or 720794676060 ns)
Verifying cases where renders should be the same:
  test_cases.csv_renders/059.png -- test_cases.csv_renders/079.png : PASS
  test_cases.csv_renders/065.png -- test_cases.csv_renders/068.png : FAIL
  test_cases.csv_renders/107.png -- test_cases.csv_renders/109.png : FAIL
...
Loading up the results.csv file into your favorite spreadsheet software; you should see a nice table summary too:
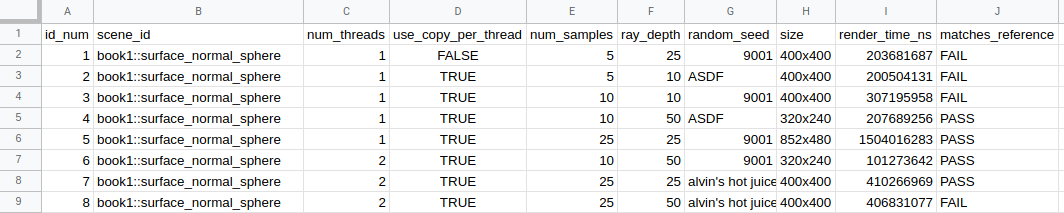
If you want to get even more fancy, you could take the results.csv from the reference renders folder, then compare the render times case-for-case. But that's beyond the scope of this article. I think the "total render time" metric suffices.
Moving Forward
There's more that we could do, but what we have done right now (in only a little bit of Python and with idiff) has provided a great framework for verifying the ray tracer works as intended. There are some things that could be improved or features added:
- Running tests in parallel. For example, my main workhorse has 12 cores, but at most any of the test cases we generated only uses 4 cores. This testing script could be a bit smarter and could queue up multiple renders at the same time.
- Though, this might cause the render time to not be as accurate (e.g. it could take longer). A solution to this could be to add a mode to do a "correctness only" run where it disregards the render time and only checks pixel-for-pixel accuracy. Then another mode could be added in to verify the performance of renders, by only running one test at a time.
- The script could also gather system information about the computer that the tests were running on. If the suite was run on an Intel Celron processor vs. an AMD Threadripper you're going to see some dramatic differences in performance. This information could be put in
results.txtor some other text file. - By having no reference images committed into the repo and not being tested against, this suite does assume that renders are 100% fully deterministic between different computers. I think it's very unlikely that an error like this could happen.
- Integration of a tool that could check for perceptual difference would also be a nice feature. When we broke the ray tracer above, all that was effected was the "visual fuzz" of the image since the rays being shot were given different random offsets. When doing a pixel-for-pixel test, this would fail. But humans wouldn't be able to tell the difference between the images for such a subtle difference.
idiff's ability to produce an image showing the differences could be used too. If you remember from the globe example, the "diffed pixels" were actually quite faint. If they appeared more vividly, we could consider that a noticeable/perceptual difference.
I hope that this walkthrough provided you with a good insight on how to add some level of testing to your graphics application. It's a topic that I don't seem much written about, but is fairly important.
I'd also like to note, that I am currently looking for work. If anyone is interested in hiring me, please check out my contact page (or Twitter) to get in touch with me. I do all sorts of things.