This is a blog post about nothing; at most, wasting puffs of carbon.
Have you heard about "Free Functions" before? In a super-quick nutshell they are any function that is not a member function of a struct or class. We use them all of the time and it's likely you've written some without the intent of doing so.
My first formal introduction to the concept came from Klaus Igelberger's 2017 talk "Free your Functions!". If you have not watched it yet, I would recommend taking the time to listen to it. During the presentation, there was a claim made:
Writing code as free functions may be more performant.
But if you watch the talk in its entirety, there's no benchmark given.
I was intrigued because Klaus clearly explains the benefits of free functions. I do like them from a software design and use aspect. When it came to any hard measurement, there was nothing to back this statement. His presentation is a bit on the older side so it is likely the information Klaus was presenting was relevant at the time. But now, (8+) years later, it may no longer be.
As of late, I've been very interested in the performance metering of C++. So I thought this would be interesting to investigate. I am kind of putting Klaus on blast here, so I thought it was only fair to reach out and talk to him on this. I did correspond in email with Mr. Igelberger and let him read this before publishing.
The Hypothesis
Freeing a function should not have an impact on its performance.
I don't know about the inner workings of compilers, nor how their optimizers work. I'm more of a "try a change and measure it" sort of person. If unbounding a function from a class could improve the performance that's a low cost change to the code!
We'll benchmark free vs. member functions in two separate ways
- A smaller, more individual/atomic benchmark
- A change in a larger application
I'm more of a fan of the latter since in the real world we are writing complex systems with many interconnecting components that can have knock-on effects with each other. But for completeness we'll do the smaller one too.
On this blog, all of the posts from the last five years have involved PSRayTracing. But I feel it's time to put that on the shelf. Instead it would be more practical to grab an existing project and modify their code to see if we can get a speed gain from freeing a function. We'll use Synfig for this.
A Simple Measurement
This is more in line with the benchmarking practices I always see elsewhere. We'll run this test across different CPUs, operating systems, compilers, and optimization flags. Let's say we have a simple mathematical vector structure with four data members:
struct Vec4
{
    double a = 0.0;
    double b = 0.0;
    double c = 0.0;
    double d = 0.0;
}
And we have some operations that can be performed on the vector:
We'll test these methods written three different ways:
- As a member function
- Passing the structure as an argument
- The function is no longer a bound member, but technically "free" (though requires knowledge of the struct)
- Passing the data members of the structure as function arguments
- This is the "properly freed" function
For example, this is what the function normalize() would look like with each style:
void normalize()
{
    const double dot_with_self = dot_product(*this);
    const double magnitude = sqrt(dot_with_self);
    a /= magnitude;
    b /= magnitude;
    c /= magnitude;
    d /= magnitude;
}

void free_normalize_pass_struct(Vec4 &v)
{
    const double dot_with_self = free_dot_product_pass_struct(v, v);
    const double magnitude = sqrt(dot_with_self);
    v.a /= magnitude;
    v.b /= magnitude;
    v.c /= magnitude;
    v.d /= magnitude;
}

void free_normalize_pass_args(double &v_a, double &v_b, double &v_c, double &v_d)
{
    const double dot_with_self = free_dot_product_pass_args(v_a, v_b, v_c, v_d, v_a, v_b, v_c, v_d);
    const double magnitude = sqrt(dot_with_self);
    v_a /= magnitude;
    v_b /= magnitude;
    v_c /= magnitude;
    v_d /= magnitude;
}
To benchmark this, we'll create a list of pseudo-random vectors (10 million), run it a few times (100), and then take down the runtimes of each method to compare. For the analysis, we'll compute the mean and median of these sets of runs. Between each three, we want to find which ran the fastest. If you wish to see the program it can be found in its entirety here: benchmark.cpp.
Different environments can yield different results. To be a bit more thorough, we'll compare on a few different platforms:
- Three CPUs: an
Intel i7-10750H, anAMD Ryzen 9 6900HX, and anApple M4 - Three different operating systems:
Windows 11 Home,Ubuntu 24.04, andmacOS Sequoia 15.6 - Three different compilers:
GCC,clang, andMSVC
Not all combinations are possible (e.g. no Apple M4 running Ubuntu 24.04 with MSVC generated code). Whatever was feasible was tested.
Compiler flags can also play a role. For even more zest in this test, optimization flags such as -O0, -O3, -Ofast, /Ot, /Ox have been specified. This post doesn't have the exhaustive list; check the Makefile to see.
Across these 4 dimensions, there are 48 different combinations and 12 functions to run so that's 576 sets of runs. It... took a while... If you wish to see all of the final data and analysis, it can be found in this Excel sheet and this Jupyter Notebook.
 (Data looks like this)
I don't want to bore you with any of the analysis code (see the Jupyter Notebook if you wish).
The key variable in it is ms_faster_treshold = 10.0. So if one style (e.g. "pass by args") is more performant than the other two, that style would need to be at least 10 milliseconds faster.
So What Was Discovered?
There isn't much of a difference; barely. Out of those 576 run sets, only a whopping 8 had a significant performance difference. Here are all of them:

A lot of the rows aren't showing a large enough value for the time_ms_faster . Not even single digit improvements, a good chunk being only 0.34 ms or even 0.03 ms faster than the other two; which is not conclusively faster (or slower). Note that a "run set" can take anywhere from 150 ms to 300 ms to complete, which is why we're looking for a speedup of at least 10 ms
So in about 98% of the cases, whether the function was free or a member, had no significant performance difference.
Where there are gains it is (almost) exclusively coming from using clang on x86_64 Linux, at nearly all optimization levels, but only with normalize() where it was a free function using the "pass by args" style. Eyeballing the numbers, it's shaving off ~35 ms from runtimes between 185 ms ~ 205 ms. That is around a ~15% performance increase. It's actually significant! But keep in mind, this is only in 2% of the run sets.
From this benchmark, I think it might be fair to conclude this:
- Using free functions (with pass by args) can be more performant, but only with specific situations
- Member vs. free in general doesn't have a performance gain or hit
This was a very limited benchmark; not my favorite. What happens in a larger application?
Larger Systems
Small benchmarks are fine, but they can be too "academic" or "clinical". In the sense when they are applied in a bigger program (i.e. "real world"), the results may be vastly different.
As mentioned before the previous posts on this site were concerning my pandemic pet project PSRayTracing. I think it's time to retire it and use something else. Synfig!
If you're wondering "Why Synfig?", let me elaborate:
- It's another C++ computer graphics (animation!) project
- It's a bit more "real world practical" than my own ray tracer
- Fully open source
- It has a repo of nearly 700 test cases (.sif files)
- Hacking on it (and around it) is quite easy
- To automate testing was a sinch
The premise here is we will free a function used in the program and see if it leads to any significant change. The v.1.5.3 release (of Aug 2024) will be the version of code tested.
What to Free?
A method that is called a lot.
Freeing one function that is used sparsely makes no sense. I've contributed to the project a very long time ago, but I am not that familiar with the code base so I don't know its ins and outs. It wouldn't be fair to spelunk into the code, grab a random member function, free it, and then do the performance metering. There are tools that exist to find a good candidate.
Callgrind is perfect in our case. For those of you who are unfamiliar, it's part of the Valgrind suite. Its job is to generate call graphs, which can be used to see what functions are being called the most in an application. (Just note that this is very slow to run.)
CMake's build type must be set to RelWithDebInfo. This will compile the application with the -g -O2 flags. -g will add debugging information to the Synfig binaries. And -O2 gives a reasonable level of optimization. The final product would use CMake's Release mode (giving -O3), but we'll go back to that when running the benchmark.
Raw Callgrind output will look like this:
# callgrind format
version: 1
creator: callgrind-3.24.0
pid: 3476
cmd:  /home/ben/Projects/synfig/cmake-build/output/RelWithDebInfo/bin/synfig /home/ben/Projects/synfig-tests/rendering/sources/icons/tool_brush_icon.sif
part: 1

desc: I1 cache:
desc: D1 cache:
desc: LL cache:

desc: Timerange: Basic block 0 - 163286698
desc: Trigger: Program termination

positions: line
events: Ir
summary: 800111840

ob=(235) /usr/lib/x86_64-linux-gnu/libopenmpt.so.0.4.4
fl=(801) ???
fn=(93066) 0x00000000000285a0
0 5

fn=(93056) 0x0000000000028610
0 9
cob=(4) ???
cfi=(179) ???
cfn=(93062) 0x000000000bfdc920
calls=1 0
0 1292
0 1
cfn=(93066)
calls=1 0
0 5
0 3

...

368 2
+13 6
cob=(4)
cfi=(179)
cfn=(67574)
calls=1 0
* 24
fi=(1044)
3235 3
fi=(1045)
381 1
fi=(1044)
3235 1
fe=(1046)
2381 2
fi=(1044)
499 2
fe=(1046)

totals: 800111840
Any output can easily be around 500K lines; I'm cutting a few out for brevity's sake. This seems like a bunch of gibberish, but it needs to be loaded into something like KCachegrind to make some more sense of the output.
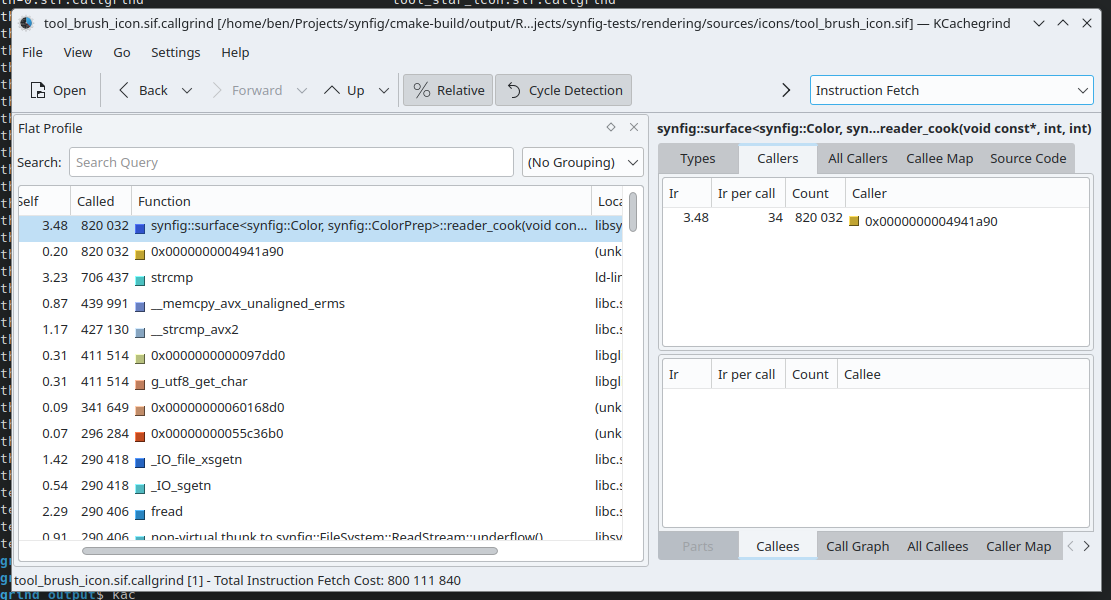
Here we can see this synfig::surface<T>::reader_cook() function is called quite a bit. Maybe it's a good function to free? No. This was only checking a single file, we should be more thorough. Synfig's repo of test data has hundreds of files we can check. An instinct might be to grab a handful of files from this repository and check those. But we can do better: check it all.
Python is amazing. It has everything you need for automating any task. Running Callgrind on a directory tree of 680 files takes a while for a human to do. Python can automate that away for you. So I wrote a script that does that.
The next problem is that we have 680 files containing the Callgrind output. We're not going to load each one of these files in KCachegrind. That would be absurd.
Python is magic. We can easily combine all of this output to make a sort of "merged Callgrind report" from the entire test repo. So I wrote a script that does that.
This uses a slightly different tool by the name of callgrind_annotate, which essentially is a command line version of KCachegrind. It gives us what we need to know: which functions are called the most. Thus letting us hunt down what is the best candidate to free. One thing to note is that there's a lot of non-synfig functions in the callgrind output. For example, if you look at the above screenshot things like strcmp() pops up. We need to filter for only Synfig's code. And that's easily solved via grep:
cat combined_callgrind_output.txt | grep synfig
Which leads us to these candidate functions:
Instead of testing all three, we're only going to test freeing Color::clamped(). It's very simple and what I think is the most straightforward to liberate.
How to Free?
There are three different ways we can unbind this function from the Color class:
- Change it to a
friendfunction - Set the data to
public - Refactor the function to require the caller to pass in arguments
- this is the proper way
Similar to the smaller benchmark, I don't think there should be any performance difference from the baseline (no changes) to any of the three above methods. friend and public are included here for completeness, despite not being a fully correct freeing technique. I thought it would also be interesting to see if there are any unintended side effects that could affect performance.
How to Measure?
We can modify the recursive Callgrind script to instead render all of the sample Synfig files, along with taking down the runtime.
We're going to be more limited though:
- We'll only keep it to Intel & AMD Linux machines with GCC (14.2)
- I don't believe building with MSVC works at the moment
- Building with clang didn't work (see this ticket)
- We'll only run each file 10 times. As some of the .sif files can take 30+ minutes to render
Results & Analysis
Sooo... This also took a while... Just shy of 78 hours. The Jupyter Notebook analysis is here, and the data measurements in this directory.
Altogether the runtimes taken are:
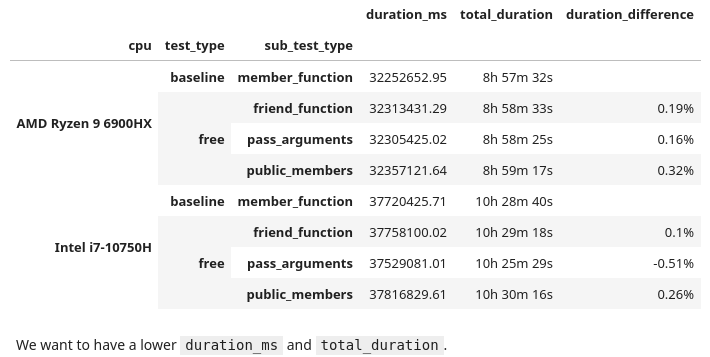
At the surface there are two observations:
friendfunctions andpublicdata members were slightly slower- On the Intel CPU, using "pass arguments" (the correct freeing method) was the only one that was actually faster
There is concern though: the percent difference from the baseline is only about half a percent. This isn't significant, it's fair to call this noise. I wouldn't feel confident in saying that free functions were a performance gain or hit here. Taking only 10 samples for each file, we would need to take around 25 before I could feel confident.
We did 10 runs of each Synfig file. What if we took the best runtime for each environment and then totaled that up?
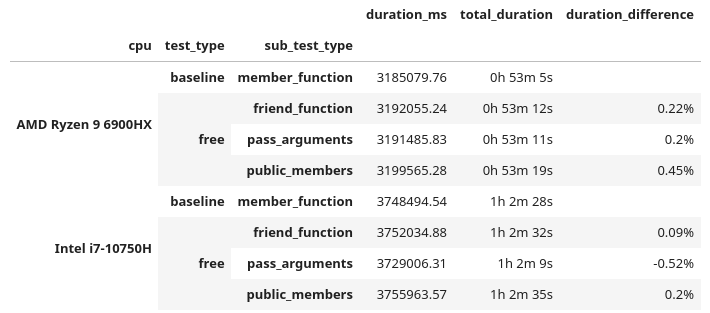
These are similar results, as the duration_difference correlates to the above. But since there is not any significant speedup (beyond 1%), I have to say it's still noise.
Right now we are looking at the cumulative runtime of the entire test repo. What if we found certain test cases that were faster? There is a chance that a specific .sif file could render faster with a free function. Luckily we have all that data to find out if there are any instances where one method was more performant. Applying a minimum 2% faster threshold:

Wow. We have a 44% performance increase for a single case, followed by a bunch of 30% boosts!! That is massive! But... I am a little skeptical. We need to peek into the data. Looking at all of the runtimes for that no. 1 performer:

So... This is a little awkward. Doing 10 runs of each .sif file (for each combination), 9 times we have a measurement of 164 ms, but 1 time it took 114 ms. It doesn't feel right to call that a best case run. I'd call that a bad data point. It's possible there could be some others. Luckily there are ways we can throw out undesirable data. Z-Scores are a way to find outliers:

If we can find them, we can throw them out. Using a threshold of 2.0. This ends up tossing out about 5.3% of the data. Not an ideal, but something that I think we can still work with.

Now this is interesting. When we accumulate all of the runtimes with this cleaned data, each time the free function performs faster than the member function! A few are in the range of noise, but the others are significant. A 1.5% ~ 2.8% speedup! But let's take a look when we filter for the best case runtime:

Now we have a different story. All of the duration differences are back in the range of being noisy. From here, we need to take a deeper look at the (cleaned) data. I took a look at a few of the run sets, finding one in specific that is quite peculiar, no. 754 (which is file 075-ATF-skeleton-group.sif). Computing the Z-scores for this run set:

In these 10 data points:
- Half congregate around
515 ms - The other half hover at
464 ms - All of their Z-scores do not go above the threshold (2.0), so each one is kept in
- All of the Z-scores are effectively the value
-1.0and1.0
This unfortunately means that the entire run set is bad data, which further cascades to the other tests that use the same file, thus requiring us to throw out 80 data points. Not good.
I tried adjusting to have an even more sensitive Z-score threshold (e.g. 1.5, 1.0, etc.) but that led me to throwing out a whooping 30% of the original data. If you play around with the Z-score you will find cases where the free functions were faster, then slower, then faster, then slower... I even tried out IQR as another means of removing bad data, but that also didn't work as desired.
With what we have right now, more testing would be required to make a definitive answer. But for Synfig, I don't find freeing functions concretely helping or hurting performance.
It's also likely that Synfig might not be the best "large integrated benchmark", seeing as we had some files with fluctuating runtimes. Maybe Blender is a better test bed. This is one of the issues of working with a code base you don't know that well. There could be something non-deterministic in the supplied test files. I don't thoroughly know this code; I'm making a wild guess here.
What has been done here is very much in the realm of microbenchmarking. It's hard to do, and difficult to find consistent results.
Conclusions & Thoughts on Free Functions
I don't think there is a practical performance benefit.
Architecturally I can see how free functions make sense. But if you're rewriting a function to free it, in hopes that it will make your code faster; it probably will not. It will be a waste of time that could introduce bugs into a working code base. Once again let me remind you, this is an article about nothing.
In the smaller benchmark we did find a significant performance increase, but I need to remind you that it was only being observed 2% of the time and in a very specific case (clang compiled code on Intel/Linux machines). But when we freed a (commonly called) member function in a larger application the performance bounced between being measured as faster or slower, all depending on how we looked at some data.
I don't want to stop others from writing free functions because there are no real performance benefits. I want them to write free functions if they think that is the better solution for their problems. It's very likely back in 2017 when Klaus first gave his talk that free functions were more performant than member functions. From that time to now, it is possible that compilers could have improved to optimize member functions better. As stated before, I'm not familiar with the internals of compilers and their under the hood advancements. I'm a very surface level C++ developer. I have to defer to people smarter than me on this matter.
This is a bit of an aside, but in one of my early jobs I had a higher-on-the-food-chain-coworker who one day wanted everyone to only write code (in Python) using functional paradigms. This was many years ago when Haskell and the ilk were much more in vogue. His claim was "functional programming is less buggy". He never provided any study, research, resource, document, database that backed up this claim. His reasons were vibes and appealing to the authority of Hacker News and that the URL had "medium.com" in it. This paradigm shift did nothing other than just introduce new problems. For example, taking a simple 3 line for-loop and then blowing it up to 7 line indecipherable list comprehension; this happened more than once. If you didn't fall in line, his solution was to berate and shame you in a public Slack channel and ignore your PRs. I'm glad I don't work with this guy anymore.
You might have thought that we proved absolutely nothing here and just wasted a bunch of electricity and time. I've said this twice already. But we've also discovered the inverse: if you want to free a function, you can rest assured there isn't a performance hit. We've also incidentally shown proof that public vs. private data, and friend functions, pass by struct, etc should not cause any performance changes.
I hope that you've watched Klaus' talk, because he does an excellent job of explaining the benefits of free functions. The big one for me is flexibility. I used to dabble in the Nim language a lot more in my past. I still miss it as it's really cute. It has Uniform Function Call Syntax. This makes any language way more ergonomic. Multiple times it has been proposed for C++, and was even talked about in Klaus' presentation. Herb Sutter's Cpp2/cppfront (which I think will be the next major evolution of the language,) has support for UFCS. We will not have any performance hit for this. Give it a try.
My only criticism I have of the old presentation is Klaus never provided a benchmark. I have been watching his talks for years and have always enjoyed them. One of his more recent talks from 2024 does include one. I would like to thank him for taking the time to email me back and forth over the past few months while I worked on this.
If anyone here is also looking for a project to brush up on their C++ skills, Synfig is great to check out. These people were very kind to me years ago when out of nowhere I just plopped in some tiny performance improvements and then didn't return for 5 years. They make it so damn easy to get set up. Blender gets a lot of attention, but I think this project needs some love too.
Since this is now my 4th try investigating performance claims in C++, if anyone has any suggestions on another topic they would like me to investigate, please reach out. I've made lots of scripts and tools in the past year+ to do these investigations. I'm wondering if there is any interest in creating a generic tool to do performance metering and test verification. I want to take a break and work on other projects in the near future though. So I won't be doing anything like this for a while.
Likewise, if anyone is interested in me profiling/investigating the performance of their code, reach out as well.
My main hope is that with these articles, we will stop making claims (i.e. performance improvements) without providing any measurements to back up our statements. We're making wild assertions but not testing them. This needs to stop.
If you just scrolled down here for the tl;dr: free functions don't have much of any performance difference from that of member functions.